 Matt Lane
 This article was first published on Medium in October 2014
Google Analytics is great, and tracks lots of stuff just with the default set-up. But it can do a lot more with very little additional work. I add Google Analytics tracking code to websites often, so over time have come to standardise the way I complement the default tracking code, and the steps I take when setting it up on a new site. You don’t need to understand HTML or JavaScript to understand this article.
This article will explain how to:
- Increase the sample rate for your site speed tracking
- Get enhanced link attribution in your in-page analytics
- Enable demographic and interest reports
- Set up filtered views of your traffic
- Configure site search tracking
- Fixing the visit length calculation
- Track downloads and external links
Shout out: My understanding of pretty much all of this stuff is a consequence of working with Vaughan Curd, and Keith Bolland
If you’ve heard of Google Analytics, but are unfamiliar with it, you might want to first read:
For reference, in 2014, the default Universal Analytics tracking code looks like this (you don’t need to understand this code):
<script>
(function(i,s,o,g,r,a,m){i[‘GoogleAnalyticsObject’]=r;i[r]=i[r]||function(){
(i[r].q=i[r].q||[]).push(arguments)},i[r].l=1*new Date();a=s.createElement(o),
m=s.getElementsByTagName(o)[0];a.async=1;a.src=g;m.parentNode.insertBefore(a,m)
})(window,document,’script’,’//www.google-analytics.com/analytics.js','ga');
ga(‘create’, ‘UA-XXXXX-X’, 'auto');
ga(‘send’, ‘pageview’);
</script>
1. Site speed sample buff
No one likes a slow website, and we know that slow websites lead to lower engagement rates (and higher bounce rates). In addition, Google incorporates site speed in page rankings. Site speed data is useful for working out when your website is slow (and providing some clues as to how you might fix it).
By default Google Analytics collects site speed data for 1% of your users. Google says themselves:
“If you have a relatively small number of daily visitors to your site, such as 100,000 or fewer, you might want to adjust the sampling to a larger rate.”
Of the hundred or so websites I track, only a handful come close to getting more than 100,000 visitors a day. Drawing insights from your data requires having enough data to provide statistical significance. 1% of not very many = hardly any (and not enough to draw decent insights from).
ikrima at Kite and Lightning has a useful guide for what sample rate you might consider (per monthly visits):
“Monthly Visits : _setSiteSpeedSampleRate Value
1–10,000 : 100
10,001–20,000 : 50
20,001–50,000 : 25
50,001–100,000 : 10
100,001–250,000 : 5
250,001–500,000 : 3
500,001–999,999 : 2
1,000,000+ : Don’t override the default”
Assuming your site gets less than 10,000 visits a month, this leaves your code looking like this:
<script>
(function(i,s,o,g,r,a,m){i[‘GoogleAnalyticsObject’]=r;i[r]=i[r]||function(){
(i[r].q=i[r].q||[]).push(arguments)},i[r].l=1*new Date();a=s.createElement(o),
m=s.getElementsByTagName(o)[0];a.async=1;a.src=g;m.parentNode.insertBefore(a,m)
})(window,document,’script’,’//www.google-analytics.com/analytics.js','ga');
ga(‘create’, ‘UA-XXXXX-X’, ‘auto’, {'siteSpeedSampleRate': 100});
ga(‘send’, ‘pageview’);
</script>
You will now receive more data for site speed.
2. Enhanced link attribution
With another little change to the tracking code, and the tick of a checkbox in your Google Analytics admin settings, you can enable enhanced link attribution for your in-page analytics. Enhanced link attribution lets you:
“See separate information for multiple links on a page that all have the same destination. For example, if there are two links on the same page that both lead to the Contact Us page, then you see separate click information for each link.
See when one page element has multiple destinations. For example, a Search button on your page is likely to lead to multiple destinations.
Track buttons, menus, and actions driven by javascript.”
This new change leaves your code looking like this:
<script>
(function(i,s,o,g,r,a,m){i[‘GoogleAnalyticsObject’]=r;i[r]=i[r]||function(){
(i[r].q=i[r].q||[]).push(arguments)},i[r].l=1*new Date();a=s.createElement(o),
m=s.getElementsByTagName(o)[0];a.async=1;a.src=g;m.parentNode.insertBefore(a,m)
})(window,document,’script’,’//www.google-analytics.com/analytics.js','ga');
ga(‘create’, ‘UA-XXXXX-X’, ‘auto’, {‘siteSpeedSampleRate’: 100});
ga(‘require’, ‘linkid’, ‘linkid.js’);
ga(‘send’, ‘pageview’);
</script>
You will now see additional information in your in-page analytics.
3. Demographic and interest reports
Google Analytics can also pull in data on users’ age, gender, and interests. This comes from he third-party DoubleClick cookie and device identifiers. Like the enhanced link attribution, this requires a change in your GA admin interface and a change to you tracking code.
The new line will look like this:
<script>
(function(i,s,o,g,r,a,m){i[‘GoogleAnalyticsObject’]=r;i[r]=i[r]||function(){
(i[r].q=i[r].q||[]).push(arguments)},i[r].l=1*new Date();a=s.createElement(o),
m=s.getElementsByTagName(o)[0];a.async=1;a.src=g;m.parentNode.insertBefore(a,m)
})(window,document,’script’,’//www.google-analytics.com/analytics.js','ga');
ga(‘create’, ‘UA-XXXXX-X’, ‘auto’, {‘siteSpeedSampleRate’: 100});
ga(‘require’, ‘linkid’, ‘linkid.js’);
ga(‘require’, ‘displayfeatures’);
ga(‘send’, ‘pageview’);
</script>
*Please note*: Adding Google’s demographic and interest reports requires a change to your website’s privacy policy.
You will now have access to visitor demographic and interest reports.
4. Set up filtered views of your traffic
Depending on the site that you are tracking, it may be that a significant amount of your traffic is by the:
- operator/owner/parent organisation of the website
- vendor who looks after the website
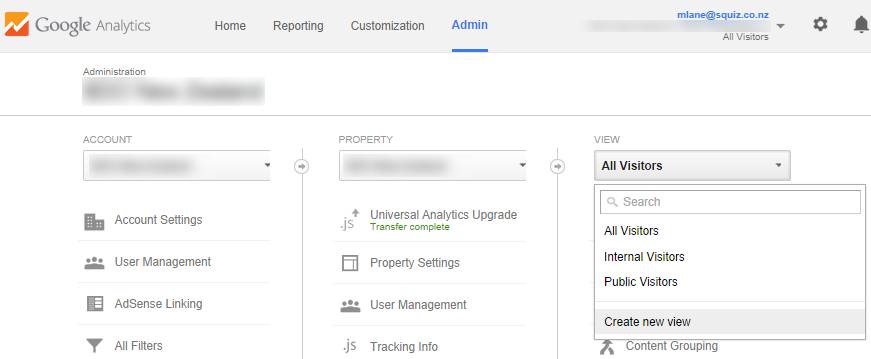
Either way, it is probably a good idea to set up some filtered views. A “view” is a perspective of the raw data for a “property” (generally property=website) you are tracking. By default, Google sets up one unfiltered view for your property. You can create new “views” in the Google Analytics admin menu:
Generally, I would propose having at least these views as a default per domain:
- One unaltered, raw data view
- One view excluding the traffic from the operator/owner/parent organisation AND the vendor (probably using IP address exclusions)
- One view of JUST the traffic from the operator/owner/parent organisation (again, probably via IP address rules)
Having these views makes it much easier for you to answer curly questions about whether it is “public” users or “staff” who are doing specific things on your site.
Giving your views informative names
The other tip is: make view names (and any filters you create) as descriptive as possible. Your view names should be understandable to someone who isn’t you, and may have very little context. Here are some examples of bad view names (not descriptive or informative):
- John’s view
- View 13
Here are some examples of informative view names:
- www.domain.com (UNFILTERED)
- www.domain.com (EXCL. <orgX> and <orgY>)
- www.domain.com (JUST <orgX>)
- dir /place* (EXCL. <orgX> and <orgY>)
Just by scanning these names, a complete outsider (or new employee) can understand what data they should expect inside each one.
You (or the next person) will now be able to quickly see filtered views of your data.
5. Site search tracking
By default, Google Analytics tracks the pages that a visitor views. Often you can infer what users are searching for by looking at URLs in Google Analytics, but your life will be much easier if you set up site search tracking on day 1.
Site search tracking needs to be set up per view (see step 4 above). Google provides guidance on setting up site search tracking.
You will now be able to see site search reports.
6. Fixing the visit length calculation
Only recently did I realise how potentially misleading Google Analytics’ visit length measurement is. This is well explained (from a glass-half-full perspective) in a post by Justin Cutroni:
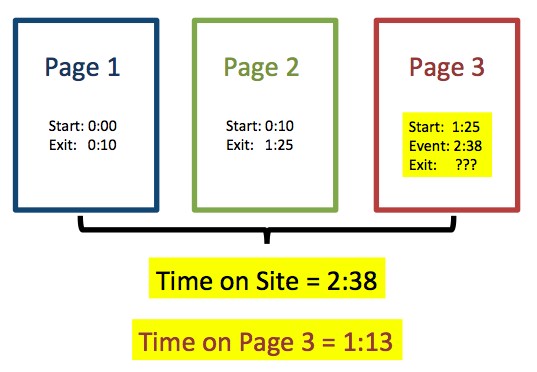
“the visit length measurement includes the time between the first hit and the last engagement hit of the session …
If no other page is viewed during the visit, Google Analytics use the time between the initial page hit and the last engagement hit that follows the page hit.
Let me make this clear, if a visit only contains one pageview (i.e. the visit is a bounce) then Google Analytics can track time on page by using other engagement hits.”
In other words, if a visit contains one pageview and no engagement hit (see Understanding Engagement Hits), neither time on page, or time on site can be calculated.
From a glass-half-empty perspective by Brian Cray:
Bob enters your site, loyally reads an article for 2 minutes and 13 seconds, saves it to his browser bookmarks, then leaves. Can you see the problem? Bob never interacted with the webpage. To Google, this is a bounce. And bounced visits get marked with 0:00 Time On Site. In other words, your Bounce Rate just got inflated and your Avg. Time On Site just got its ass kicked.
Brian Cray proposes a solution in the same post by adding a silent timing event:
Javascript magic
Paste this javascript snippet right before </body> in your HTML pages. It won’t matter if you’re using the new or old tracking code.
(function (tos) {
 window.setInterval(function () {
 tos = (function (t) {
 return t[0] == 50 ? (parseInt(t[1]) + 1) + ‘:00' : (t[1] || ‘0') + ‘:’ + (parseInt(t[0]) + 10);
 })(tos.split(‘:’).reverse());
 window.pageTracker ? pageTracker._trackEvent(‘Time’, ‘Log’, tos) : _gaq.push([‘_trackEvent’, ‘Time’, ‘Log’, tos]);
 }, 10000);
})(‘00');
Once this code is installed, your site will update Google Analytics every 10 seconds under the Event Category “Time”, the Event Action “Log”
Though, as mentioned by Nick Skelton on Sam Collins’ Mind the Product:
“…be careful implementing the ‘Time on Site’ code featured above. Analytics has, I believe, a limit of 500 events, including pageviews, it can track per user session. This could quite easily eat into that limit. Especially important if you’re doing other Event Tracking calls and/or have users opening your site in multiple windows.”
So, depending on the site, consider raising the number of milliseconds to fire every 20/30/60 seconds.
Note: Events can be “interactive” or “non-interactive”. If you make these time on site events “interactive” they will lower your bounce rate (single pageview visits that last longer than 10 seconds will no longer be counted bounces), whereas making them non-interactive events will not affect your bounce rate.
Now you will have a much more accurate idea of how long people are staying on your site.
7. Track downloads and external links
People often falsely assume that Google Analytics can track document downloads and clicks on links to external links out-of-the-box. It can do this, but requires a little bit of configuration.
You can find instructions and a pretty robust JavaScript snippet at Blast Analytics & Marketing (you will need jQuery v1.7+ on your site):
- How to Track Downloads & Outbound Links in Universal Analytics
- How to Track Downloads & Outbound Links in Google Analytics
Caveat: This method tracks clicks on links—it could fail in two ways:
- You have broken links to documents (in which case you are counting actions which are only attempted downloads)
- Visitors are getting to documents via direct links from outside of your website (in which case you are failing to track downloads).
You will now be able to (mostly) see which documents visitors are downloading on your site, and which external links they are clicking on.
Other stuff: More event tracking
All of the techniques above are fairly generic; they make sense for 95% of websites. As you know, your website is a beautiful and unique snowflake and will have its own special things you should be tracking. These might include:
- display frequency of a particular widget (maybe bespoke advertisements)
- clicks on call-to-action buttons (this could include newsletter or magazine subscriptions, membership applications etc)
- multi-page form progress and completions (if your pages all only have one URL)
My goal with these tricks is to be collecting all of the data that we don’t always realise we might need. By setting these up early on you’ll have a better chance of having already collected the data to answer the curly question that comes in a week, month or year in the future.
